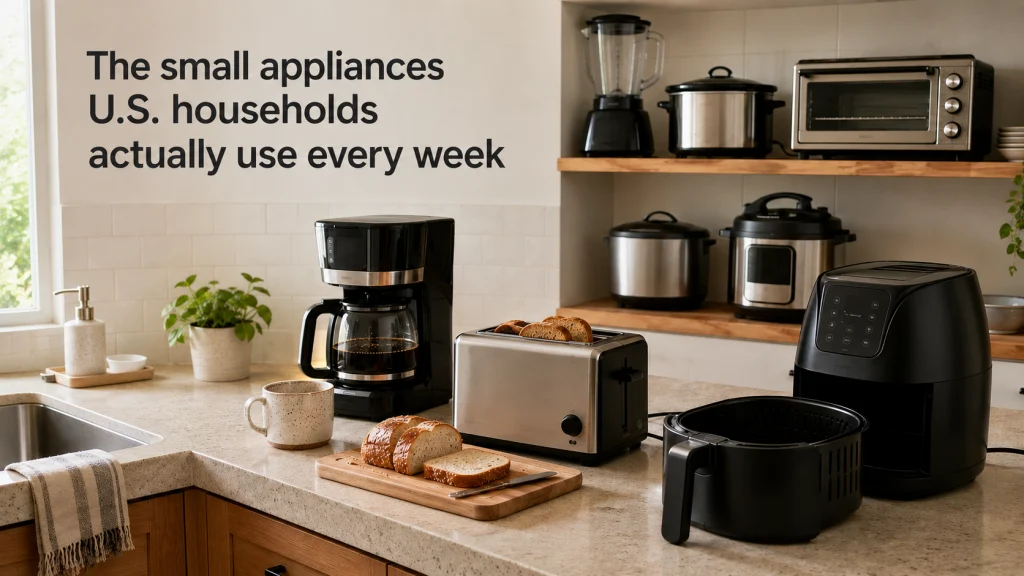
Weekly use data gives a very different picture of small kitchen appliances than a scroll through social media. In the latest preliminary Residential Energy Consumption Survey appliance table, coffee makers and toasters appear in far more weekly household routines than electric pressure cookers, while air fryers already reach a large share of U.S. homes. Those numbers show routine adoption, not product quality, satisfaction, or what any one household should buy. The useful takeaway is simpler: an appliance earns its place when it matches a job your household actually repeats.
Weekly use is not the same thing as a ranking
Social feeds can make every new countertop appliance look universal, but national household data is much less dramatic. The latest preliminary RECS appliance table shows coffee makers in weekly use in an estimated 97.12 million U.S. homes, compared with 18.46 million for Instant Pot or other electric pressure cookers. Air fryers sit between those extremes at 57.93 million homes, which is a substantial weekly footprint without being anything close to universal. The point is not that one category wins and another loses, but that routine use varies sharply by the job an appliance is expected to do.
That distinction matters before anyone turns prevalence into shopping advice. A coffee maker can support a short, repeatable task that happens every morning in many homes, while an electric pressure cooker may be extremely useful in a household that uses its particular cooking style only a few times each month. Weekly prevalence therefore tells us which appliance categories have become recurring habits at national scale, not which products are better. The more useful question is what those habits reveal about the kinds of kitchen jobs people repeat often enough to keep an appliance in regular rotation.
What the RECS numbers actually measure
The Residential Energy Consumption Survey is administered by the U.S. Energy Information Administration to a nationally representative sample of housing units. The current cycle collected detailed household information from nearly 17,000 respondents selected to represent about 132.5 million occupied primary residences across the United States. For the small-appliance portion of table HC3.1, the question is whether a listed appliance was used at least once each week. More than one category could apply to the same home, so the percentages should never be added together as if each household belonged to only one appliance group.
The wording also matters because this is a use measure, not a simple ownership count. A household may own a slow cooker and use it only a few times a month, in which case that ownership does not appear in the weekly-use estimate for the category. The table also does not tell us which brand, size, price tier, or model was used, and it does not grade the experience. Because the appliance estimates are preliminary, they should be treated as a strong national snapshot that may still be revised rather than as an immutable final count.
Eight small-appliance categories in one national view
The spread becomes clearer when the eight named categories are put on the same scale. The table below uses EIA’s estimated number of housing units for each appliance category, then calculates the share against 132.54 million occupied primary residences represented by the survey. Percentages are rounded to one decimal place, so they are calculations from the published estimates rather than separate EIA percentage figures. Because households can report more than one appliance, these shares describe category reach and are not parts of one pie.
| Small appliance category | Estimated homes using it weekly | Calculated share of U.S. homes |
|---|---|---|
| Coffee maker | 97.12 million | 73.3% |
| Toaster | 76.81 million | 58.0% |
| Air fryer | 57.93 million | 43.7% |
| Blender or juicer | 41.25 million | 31.1% |
| Crock-Pot or slow cooker | 36.04 million | 27.2% |
| Toaster oven | 34.95 million | 26.4% |
| Rice cooker | 22.89 million | 17.3% |
| Instant Pot or electric pressure cooker | 18.46 million | 13.9% |
The same calculated shares are easier to compare when each category is shown on one 0-to-100 scale. The bars below use the same figures as the table, so they add no new estimate or claim. Their job is simply to make the distance between the routine leaders, the middle group, and the lower weekly-use categories visible at a glance. The percentages remain calculations from EIA housing-unit estimates.
| Small appliance category | Weekly-use share |
|---|---|
| Coffee maker | |
| Toaster | |
| Air fryer | |
| Blender or juicer | |
| Crock-Pot or slow cooker | |
| Toaster oven | |
| Rice cooker | |
| Instant Pot or electric pressure cooker |
The visual spread helps separate social visibility from measured routine. Coffee makers reach nearly three-quarters of represented homes on this weekly-use measure, while air fryers reach a little under half and electric pressure cookers about one in seven. That gap shows how differently these appliance categories appear in regular household use, but it does not tell us whether a lower-use appliance performs better or worse for the people who rely on it. The chart is a prevalence view, not a quality score.
Coffee makers and toasters show the power of simple repeated jobs
Coffee makers lead the named categories at 97.12 million homes, or about 73.3% of the national total represented in the table. Toasters follow at 76.81 million homes, about 58.0%. Neither category needs a long feature list to explain why it can become part of a weekly routine. Making coffee and browning bread are narrow jobs, but they can recur often enough that a dedicated appliance avoids repeated setup and earns an easy-to-reach spot on the counter or in a nearby cabinet.
This is a useful counterweight to the idea that versatility automatically creates more value. A machine that claims ten functions still has to compete for storage, counter space, cleanup time, and attention, while a simpler appliance can succeed by doing one frequent job with little friction. The data cannot prove that simplicity caused the higher weekly use, so that would be an overreach. What it can show is that highly repeated, clearly defined tasks are associated with the broadest weekly reach among the categories EIA measured.
The air fryer has a large weekly footprint without being universal
Air fryers appear in weekly use in an estimated 57.93 million homes, equal to about 43.7% of the represented total. That puts the category well below coffee makers and toasters, but clearly above the blender-or-juicer group and the other named cooking appliances in this table. It is a notable level of routine adoption for a category that often gets discussed as if every kitchen either has one or urgently needs one. Nationally, the data says something more measured: air fryers are common weekly tools, but most represented homes are not counted as weekly users.
That last point is important when translating popularity into a household decision. An air fryer that matches a repeated cooking job, fits the available counter or storage space, and has a cleanup routine the household will tolerate may be worth keeping in regular rotation. A household that rarely cooks the foods or batch sizes that suit the appliance can see the same national popularity and still have no practical reason to buy one. For readers moving from this data story to an actual purchase decision, our overview of small kitchen appliances and household fit is the more relevant next step.
The middle group shows why versatility is not the whole story
Blenders or juicers are reported in weekly use in 41.25 million homes, about 31.1% of the represented total. Crock-Pot or slow cookers come next at 36.04 million homes, about 27.2%, followed closely by toaster ovens at 34.95 million, about 26.4%. These are all familiar appliance types with multiple possible uses, yet none reaches even half of U.S. homes on the weekly-use measure. The gap is a reminder that having several possible functions does not guarantee that any one of them happens often enough to create a weekly habit.
A blender can handle smoothies, sauces, purees, and some food-prep jobs, but a household that does those tasks only occasionally may still leave it in a cabinet most weeks. A slow cooker can handle substantial meals with relatively little active attention, yet that strength matters only when the household actually uses that cooking pattern regularly. A toaster oven can cover reheating, browning, and small-batch cooking, but it also asks for counter space that may be more valuable in a compact kitchen. The practical lesson is to count repeated tasks first, then decide how much versatility is genuinely useful instead of paying for theoretical flexibility.
Lower national use does not mean lower household value
Rice cookers are reported in weekly use in 22.89 million homes, around 17.3% of the represented total, while electric pressure cookers are at 18.46 million homes, around 13.9%. Those are the two lowest weekly-use shares among the eight named categories, but calling them unpopular failures would misuse the data. A national share compresses many different cooking routines into one number. It cannot show how valuable a rice cooker is in a household that prepares rice several times a week or how useful an electric pressure cooker is for a household that repeatedly relies on its specific cooking methods.
This is one of the easiest first-time buying mistakes to make: assuming that a less common appliance is automatically a worse purchase. Household fit works in the opposite direction, because the relevant test is whether the appliance serves a recurring job well enough to justify its space, cleanup, storage, and cost. A product used four times a week by a smaller group of households can be more valuable to those households than a nationally common product they personally would barely use. Prevalence gives context for how widespread a habit is, not permission to dismiss a narrower but well-matched tool.
Housing type changes some patterns, but not all of them
EIA also breaks the estimates out by housing-unit type, which reveals a few contrasts worth noticing without pretending the table explains their causes. Coffee-maker weekly use works out to about 79.2% of single-family detached homes, compared with roughly 59.3% of apartments in buildings with five or more units. Toaster use shows a similar directional gap, at about 62.6% for single-family detached homes and about 47.7% for those larger apartment buildings. Those differences are measurable in the table, but the dataset does not establish whether space, household composition, income, routines, cuisine, or another factor produced them.
Other categories are much more even across housing types. Air-fryer weekly use stays within a relatively narrow band, from about 41.7% to 46.0% across the five housing-unit types shown, while electric pressure cookers remain near the low teens throughout. Slow cookers vary more, including about 35.5% of mobile homes and about 19.0% of apartments in buildings with five or more units. The responsible reading is to describe those contrasts and stop there unless another source is used to test why they exist.
What the weekly-use data cannot tell you
National survey numbers become misleading when they are asked to answer questions they were never designed to answer. This table can show estimated weekly-use prevalence by appliance category and housing-unit type, but it cannot tell us whether owners are satisfied, whether a model performs well, or whether a purchase was regretted. It also does not measure ownership among households that use an appliance less than weekly. A category can therefore have a modest weekly share while still sitting in many additional cabinets and pantries.
That boundary also prevents a common statistical shortcut: treating common use as proof of necessity. A coffee maker can be used weekly in far more homes than a rice cooker and still be irrelevant to a household that does not drink coffee. Likewise, a low national share cannot tell you that a specialized appliance is excessive when its task is central to a particular kitchen. The numbers are most useful when they sharpen the question you ask about your own routine rather than answering the buying question for you.
Turn national frequency into a household check
The best use of this data is not to copy the national order, but to compare it with the jobs your own kitchen repeats. Start by naming the task before naming the appliance: daily coffee, toast for breakfast, reheating small portions, blending drinks, slow-cooking meals, cooking rice, or using pressure to shorten a particular recipe routine. Then look at how often that task really happens and what the appliance would add to the process. A tool that removes friction from a frequent job has a much stronger case than one purchased mainly because it is visible everywhere online.
- Count how many times the underlying task happens in a normal week.
- Check whether another appliance you already own does the same job well enough.
- Measure the counter, cabinet, or pantry space the new appliance would occupy.
- Include setup, cleanup, accessories, cords, and storage in the ownership burden.
- Decide whether the expected frequency justifies buying and storing another machine.
This check also leaves room for the cheapest answer, which may be keeping what you already have. If a task happens once every few weeks, a multifunction appliance already in the kitchen may be more sensible than adding a dedicated machine that saves only a few minutes. If the task happens nearly every day, a dedicated appliance can justify its space even if it is not the most versatile object on the counter. If you cannot name the recurring job or the friction the new machine would remove, waiting is a perfectly useful result of the check.
Final thoughts: use prevalence as context
The strongest finding here is not that one appliance category sits at the top of the table. It is that weekly use is uneven enough to challenge the idea that every heavily promoted countertop machine has become a universal kitchen habit. Coffee makers and toasters have broad routine reach, air fryers occupy a substantial middle position, and several familiar categories are weekly tools for much smaller shares of represented homes. That is useful evidence about adoption, provided it is not stretched into a verdict about quality or necessity.
For a household decision, the survey has done its job once it gives you a realistic reference point for how widespread a routine is. From there, the deciding evidence comes from your own repeated task, available space, cleanup tolerance, existing equipment, and the amount of friction a new appliance would actually remove. A common appliance can still be unnecessary in one kitchen, while a less common one can be entirely sensible in another. The data is most useful when it corrects the hype without pretending to make the purchase decision for you.
FAQs
📊 Does weekly use mean these are the most popular small appliances?
It means they have the highest reported weekly-use prevalence among the categories EIA listed. It does not measure overall ownership, satisfaction, sales, or whether people consider an appliance their favorite.
🏠 Does the survey represent all U.S. homes?
RECS uses a nationally representative sample of occupied primary residences and weights the responses to national estimates. The current cycle represents about 132.5 million occupied primary residences.
☕ Why is the coffee-maker number so high?
The table shows that coffee makers have the broadest weekly-use reach among the listed small appliances, but it does not identify the cause. It would be speculation to attribute the result to one factor without separate evidence.
🍚 Does a low rice-cooker percentage mean I should skip one?
No. If your household cooks rice frequently and a rice cooker fits your space and cleanup tolerance, the national prevalence does not make it a poor choice.
🧾 Are the percentages published directly by EIA?
The housing-unit estimates are from EIA table HC3.1. The percentages in this article are calculated from those estimates using the table’s 132.54 million total and are rounded to one decimal place.
🛒 Should I buy an appliance because many households use it weekly?
No. Use national prevalence as context, then decide based on your own task frequency, available space, cleanup burden, storage, budget, and what your existing equipment already does.
References and sources
- EIA RECS appliance table HC3.1: Provides the national and housing-unit-type estimates for small kitchen appliances used at least once each week and identifies the table as preliminary.
- EIA overview of RECS: Explains the nationally representative survey design, sample size, and represented occupied primary residences.